Edit chart
Loading graph
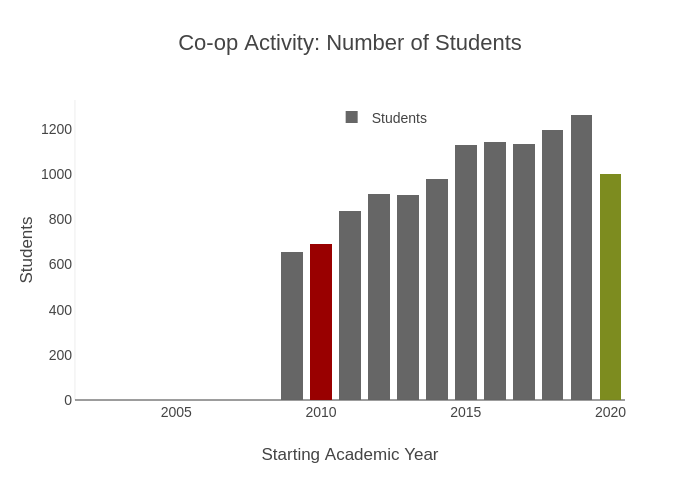
Provostncstate's interactive graph and data of "Co-op Activity: Number of Students" is a stacked bar chart, showing Students, Baseline Students, Goal Students; with Starting Academic Year in the x-axis and Students in the y-axis.. The x-axis shows values from 2001.5 to 2020.5. The y-axis shows values from 0 to 1327.3684210526317.